Plot linear regression
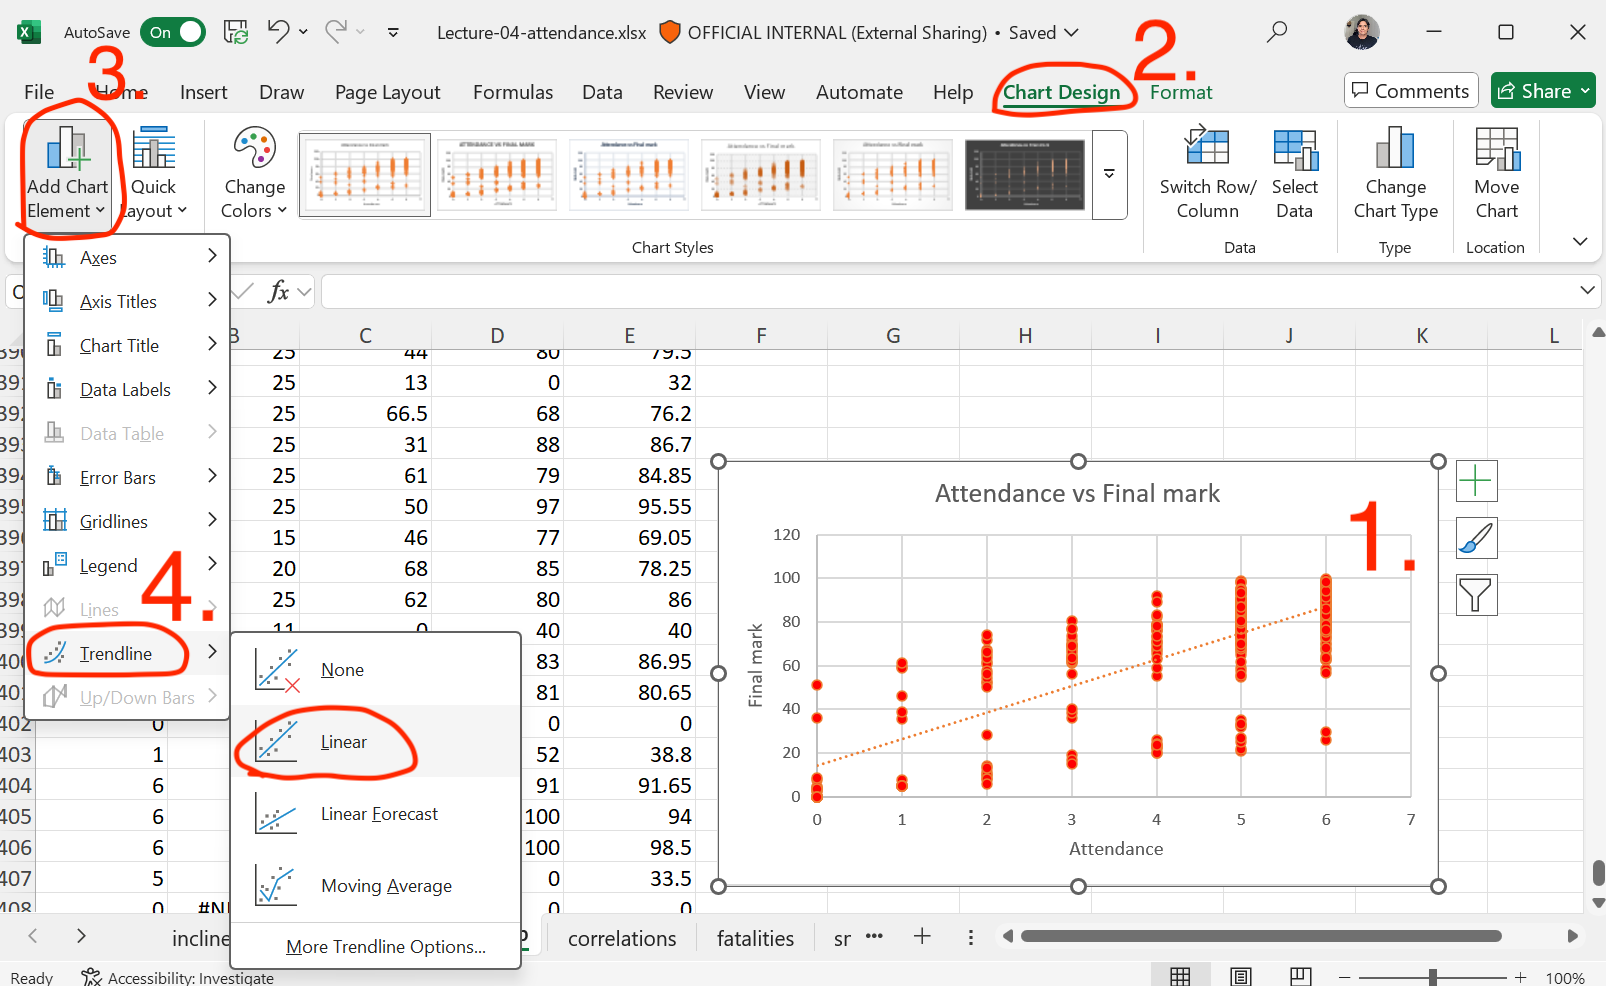
1. Select your scatter plot.
2. Click on Chart Design.
3. Click on Add Chart Element.
4. In section Trendline, click on Linear
Plot linear regression with equation
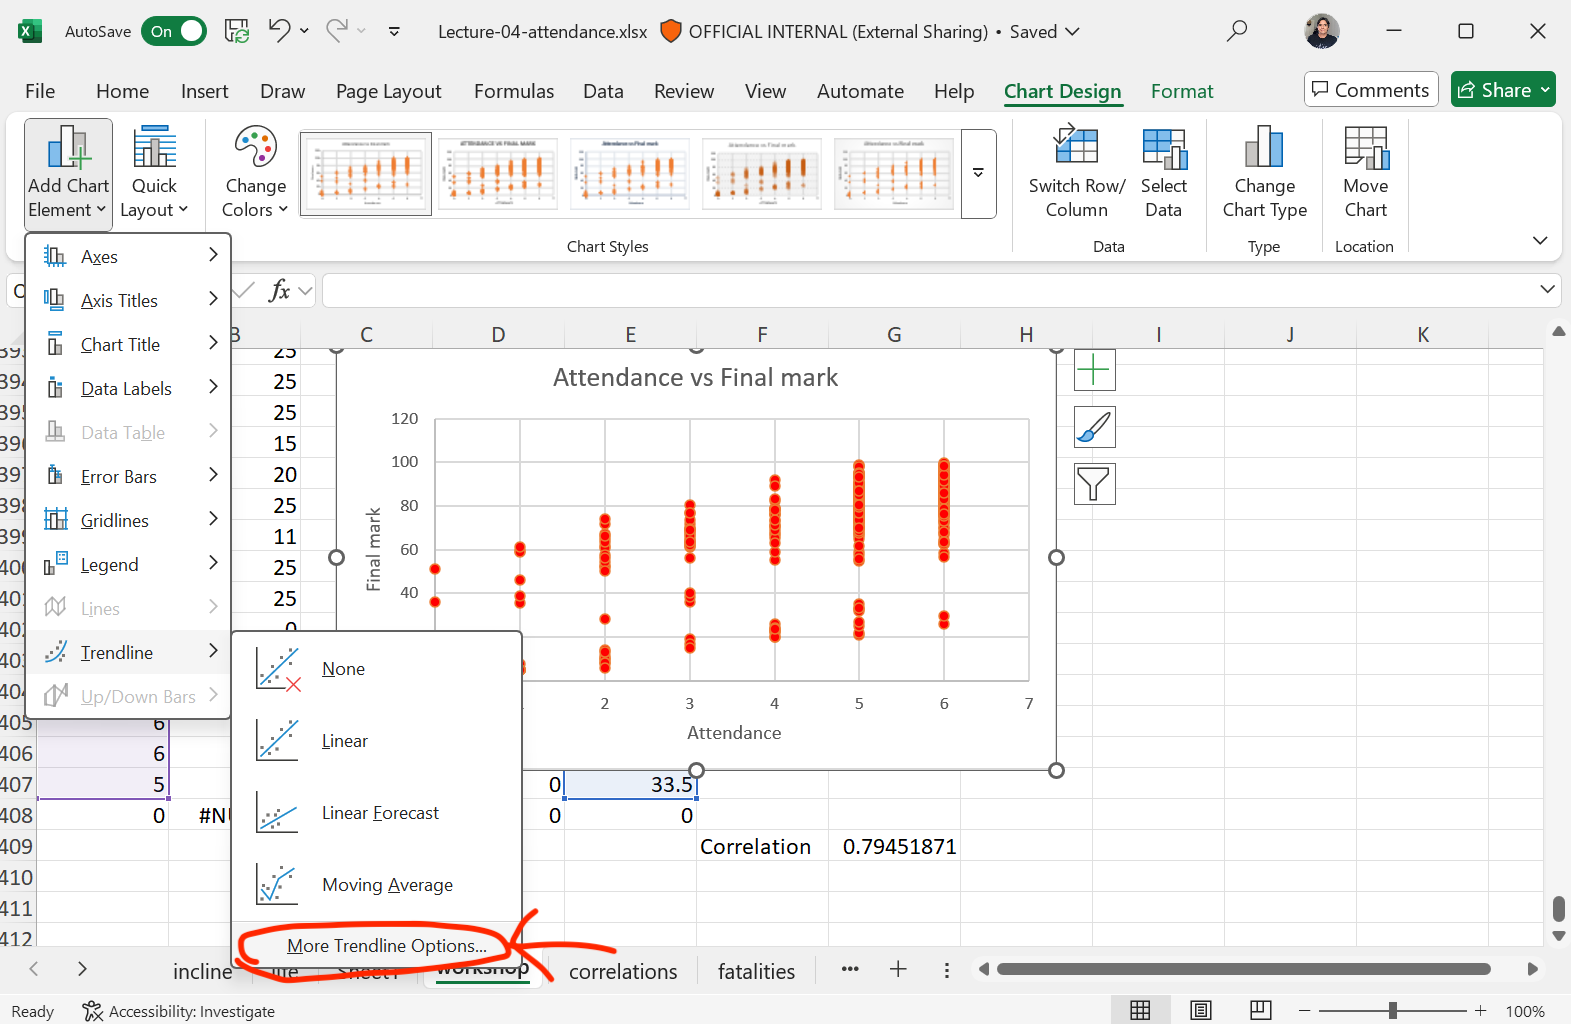
You can also select More Trendline Options
Plot linear regression with equation
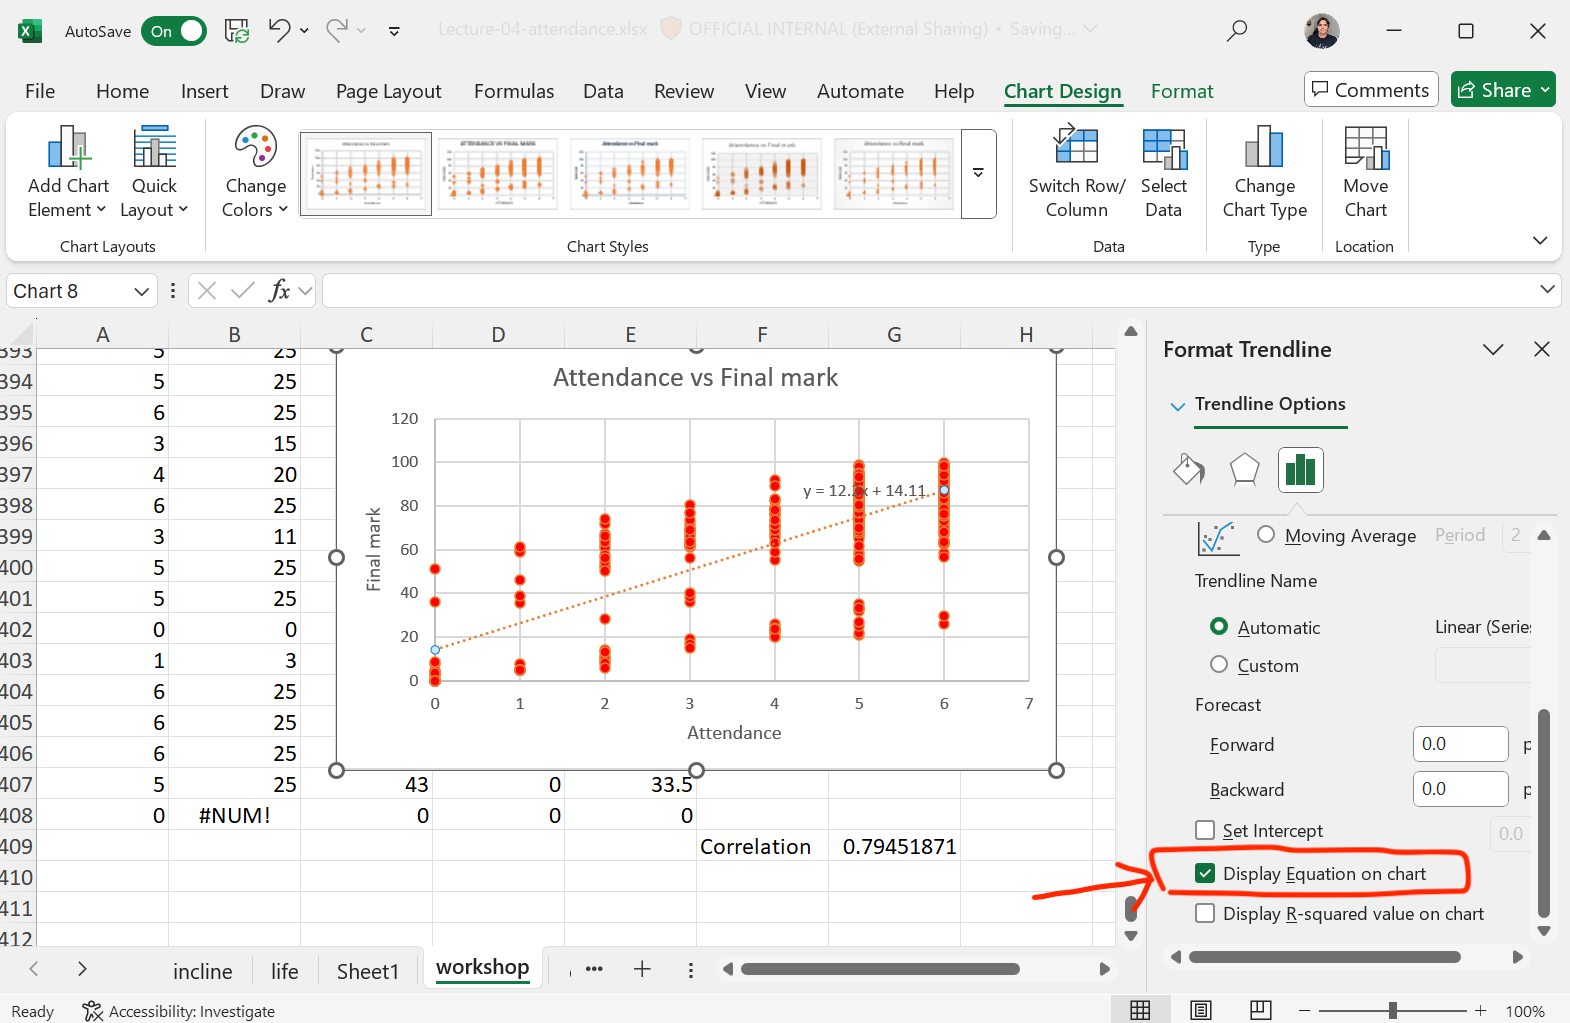
On right column menu,
select Display Equation on chart