Linear Algebra & Applications
2201NSC
Least Square Fitting

Least Square Fitting
In applications, one is often faced with over-determined linear systems. For example, we may have a bunch of data points that we have reasons to believe should fit on a straight line. But real-life data points rarely match predictions exactly.
The challenge here is to develop a method for obtaining the best fit or approximation of a specified kind to a given set of data points.
Fitting a curve to data: least squares polynomial
Experiments yield data (assume $x_i$ distinct and exact) $$ (x_1, y_1),\;(x_2,y_2),\;\cdots, \;(x_n, y_n) $$ which include measurement error. Theory may predict polynomial relation between $x$ and $y$. But experimental data points rarely match theoretical predictions exactly.
We seek a least squares polynomial function of best fit (e.g. least squares line of best fit or regression line).
Fitting a curve to data: least squares polynomial
We seek a least squares polynomial function of best fit (e.g. least squares line of best fit or regression line).
Fitting a curve to data: least squares polynomial
Example: Quadratic fit. Suppose some physical system is modeled by a quadratic function $p(x).$ Data in the form $(x,p(x))$ have been recorded as $$ (1,5),\ (2,2),\ (4,7),\ (5,10). $$ Find the least squares approximation for $p(x)$.
Fitting a curve to data: least squares polynomial
Example: Quadratic fit. $ (1,5),\ (2,2),\ (4,7),\ (5,10). $ Find the least squares approximation for $p(x).$
Consider the quadratic function $p(x) = a_2 x^2 + a_1 x + a_0$. To find the least squares approximation we need to solve the linear system:
\[ \left\{ \begin{array}{ccccccc} a_2 (1)^2 & + & a_1 (1)& + & a_0 & = & 5 \\ a_2 (2)^2 & + & a_1 (2)& + & a_0 & = & 2 \\ a_2 (4)^2 & + & a_1 (4)& + & a_0 & = & 7 \\ a_2 (5)^2 & + & a_1 (5)& + & a_0 & = & 10 \\ \end{array} \right. \]
\[ \left\{ \begin{array}{ccrcrcc} a_2 & + & a_1 & + & a_0 & = & 5 \\ 4a_2 & + & 2a_1 & + & a_0 & = & 2 \\ 16a_2 & + & 4a_1& + & a_0 & = & 7 \\ 25a_2 & + & 5a_1 & + & a_0 & = & 10 \\ \end{array} \right. \]
\[ \left( \begin{array}{ccc} 1 & 1 & 1 \\ 4 & 2 & 1 \\ 16 & 4 & 1 \\ 25 & 5 & 1 \\ \end{array} \right) \left( \begin{array}{c} a_2 \\ a_1 \\ a_0 \\ \end{array} \right) = \left( \begin{array}{c} 5 \\ 2 \\ 7 \\ 10 \\ \end{array} \right) \]
\[ \underbrace{\left( \begin{array}{ccc} \begin{array}{ccc} 1 & 1 & 1 \\ 4 & 2 & 1 \\ 16 & 4 & 1 \\ 25 & 5 & 1 \\ \end{array} \end{array} \right)}_{{\Large A}} \underbrace{\left( \begin{array}{c} a_2 \\ a_1 \\ a_0 \\ \end{array} \right)}_{{\Large \mathbf x}} = \underbrace{\left( \begin{array}{c} 5 \\ 2 \\ 7 \\ 10 \\ \end{array} \right)}_{{\Large \mathbf b}} \]
Fitting a curve to data: least squares polynomial
Example: Quadratic fit. $ (1,5),\ (2,2),\ (4,7),\ (5,10). $ Find the least squares approximation for $p(x).$
\[ \underbrace{\left( \begin{array}{ccc} 1 & 1 & 1 \\ 4 & 2 & 1 \\ 16 & 4 & 1 \\ 25 & 5 & 1 \\ \end{array} \right)}_{A} \underbrace{\left( \begin{array}{c} a_2 \\ a_1 \\ a_0 \\ \end{array} \right)}_{\mathbf x} = \underbrace{\left( \begin{array}{c} 5 \\ 2 \\ 7 \\ 10 \\ \end{array} \right)}_{\mathbf b} \]
So we have $A\mathbf x = \mathbf b$. This is an over-determined and inconsistent system but the columns of $A$ are linearly independent. Then $A^TA$ is invertible.
Fitting a curve to data: least squares polynomial
Example: Quadratic fit. $ (1,5),\ (2,2),\ (4,7),\ (5,10). $ Find the least squares approximation for $p(x).$
\[\Ra\;\; \underbrace{\left( \begin{array}{ccc} 1 & 4 & 15 & 25\\ 1 & 2 & 4 & 5\\ 1 & 1 & 1 & 1 \end{array} \right)}_{A^T} \underbrace{\left( \begin{array}{ccc} 1 & 1 & 1 \\ 4 & 2 & 1 \\ 16 & 4 & 1 \\ 25 & 5 & 1 \\ \end{array} \right)}_{A} \underbrace{\left( \begin{array}{c} a_2 \\ a_1 \\ a_0 \\ \end{array} \right)}_{\mathbf x} = \underbrace{\left( \begin{array}{ccc} 1 & 4 & 15 & 25\\ 1 & 2 & 4 & 5\\ 1 & 1 & 1 & 1 \end{array} \right)}_{A^T} \underbrace{\left( \begin{array}{c} 5 \\ 2 \\ 7 \\ 10 \\ \end{array} \right)}_{\mathbf b} \]
Since $\,A^TA\,$ is invertible, then the least squares approximation is
$\ds \hat{\mathbf x} = \left(A^T A\right)^{-1}A^T \mathbf b$ $= \left( \begin{array}{r} 1 \\ -\dfrac{9}{2} \\ 8 \\ \end{array} \right) $ $\;\,\Ra \;\, p(x) = x^2 - \dfrac{9}{2}x+8. $
Quadratic fit
Data: $(1,5),\ (2,2),\ (4,7),\ (5,10).$
Fourier series (Not assessable content)
The Fourier series of a real function $f$ defined on the interval $(-p,p)$ is given by
\( f(x)=\ds\frac{a_0}{2}+\sum_{n=1}^{\infty}\left(a_n\,\cos \left(\frac{n\, \pi}{p}x\right)+b_n\,\sin \left(\frac{n\, \pi}{p}x\right) \right), \)
where
\begin{eqnarray*} a_0&=&\frac{1}{p}\int_{-p}^pf(x)\,dx,\\ a_n&=&\frac{1}{p}\int_{-p}^pf(x)\,\cos \left(\frac{n\, \pi}{p}x\right)\,dx,\\ b_n&=&\frac{1}{p}\int_{-p}^pf(x)\,\sin \left(\frac{n\, \pi}{p}x\right)\,dx. \end{eqnarray*}
The Fourier series is named in honor of Jean Baptiste Joseph Fourier (1768-1830).
Fourier series (Not assessable content)
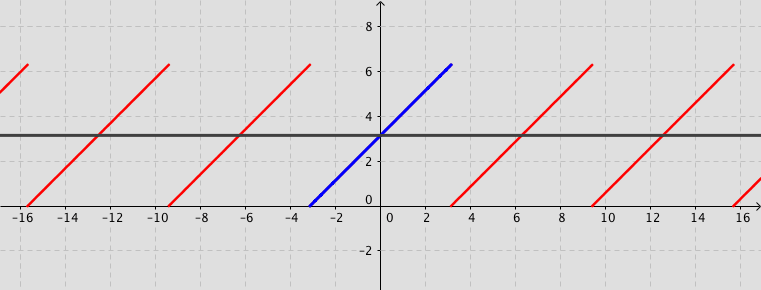
Example: Consider the function defined by $f(x)=x+\pi$ for $-\pi < x < \pi $ and $f(x)=f(x+2\pi)$ for $-\infty < x < \infty$. Its Fourier series expansion is \[ f(x)=\pi+2\sum_{n=1}^{\infty}\frac{\left(-1\right)^{n+1}}{n}\sin (n\,x). \]
Fourier series (Not assessable content)
Consider the square wave
Fourier series (Not assessable content)
|
The square wave Applets inspired by: Jez Swanson |
|
Fourier series: General example
The Cat curve 🐈
Source: Trigonometric interpolation